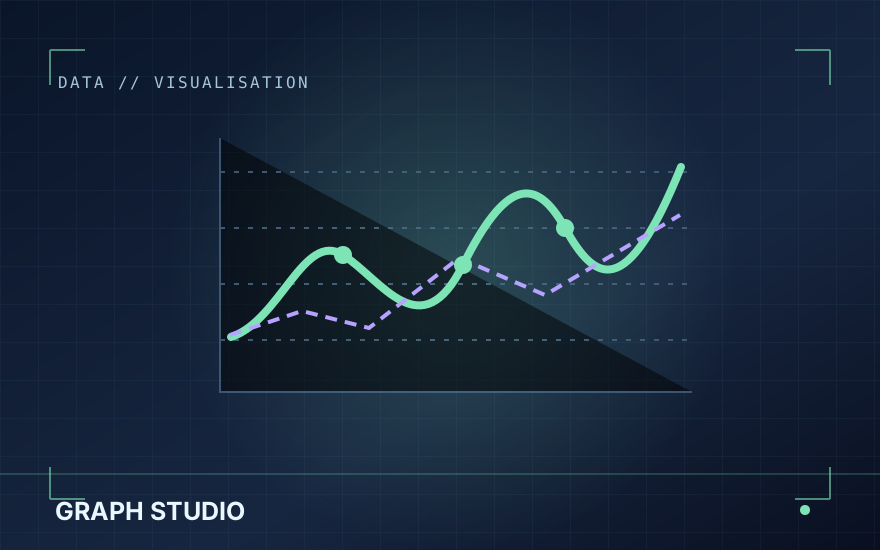
Graph Studio.
Explore and export data in an interactive graphing workspace.
Create charts and explore equations or measured data with interactive plots, useful statistics and export options.
What's it all about?
Graph Studio is part of my Tech Lab. It turns formulas, data points and imported CSV measurements into interactive charts directly in the browser.
The workspace supports multiple plot styles, inspection tools and exports for reports or further analysis. It is designed to be useful during electronics coursework and personal experiments.
The puzzle behind the idea.
Make graphing approachable without losing control over axes, plotted data and exported results.
How I'm building it.
I combine an interactive plotting interface with import/export workflows and gradually expand the available chart and analysis tools.
My role
Independent web tool: interface, graphing functionality and export workflows.